 Activity Insights (campaigns)
View statistics about the performance of individual Touchpoint activities within the context of a campaign.
To view the Distribution Insights:
- In Touchpoint, go to the Campaigns page.
- Click the campaign name.
The campaign opens on the Report page.
- Click Activity Insights.
- Click an activity listing to open it.
- Optionally, you can also filter the Activity Insights. For more information, see Filter report data (campaigns).
- Use the menu in the top left to display insights from a different activity.
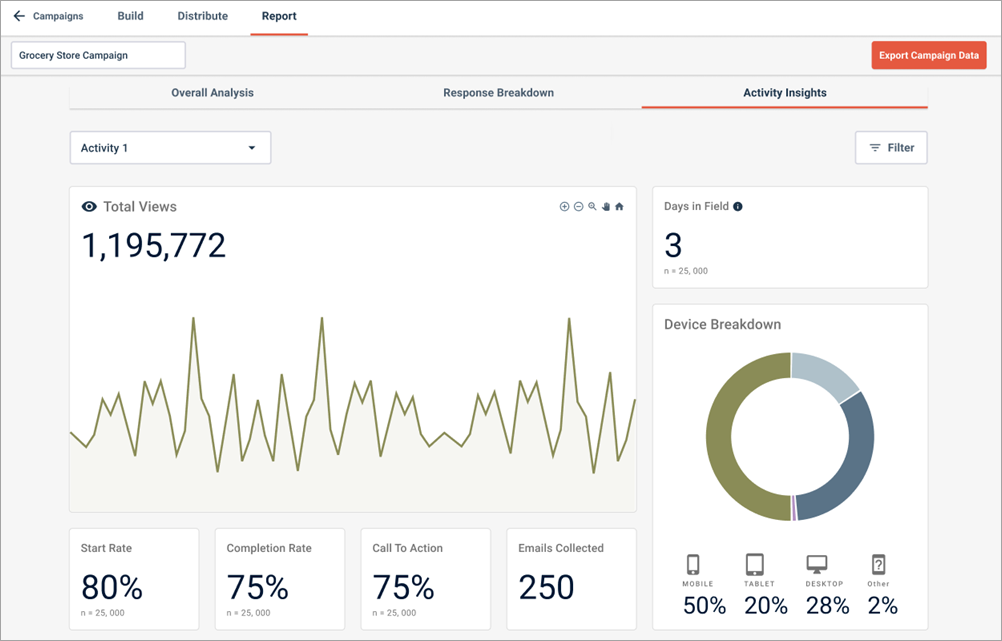
For each activity, the following information is displayed:
| Statistic | Description |
|---|---|
| Views | The total number of times the activity was viewed or loaded. |
| Starts |
The number of times participants started the activity. A participant has started the activity if they perform an action in a screen, like clicking or swiping. Merely opening the activity does not count as a start. |
| Completions | The number of times participants reached the end of an activity. |
| Calls to Action | The number of times participants proceeded through a Call To Action screen. |
| Emails Collected | The number of times participants provided a valid email address. |
| Statistic | Description |
|---|---|
| Total Views |
The total number of times the
activity was viewed or loaded; this does not necessarily mean that participants
engaged with the activity. This graph starts from the first day the activity
starts collecting data.
|
| Start Rate |
The number of times participants started the activity. A participant has started the activity if they perform an action in a screen, like clicking or swiping. Merely opening the activity does not count as a start. The larger number expresses start rate as a percentage of total views, while the smaller n number shows the absolute count. |
| Completion Rate |
The number of times participants reached the end of an activity. The larger number expresses completion rate as a percentage of total starts, while the smaller n number shows the absolute count. |
| Call To Action |
The number of times participants proceeded through a redirect in a Call To Action or Email Entry screen. The larger number expresses the Calls to Action rate as a percentage of total starts, while the smaller n number shows the absolute count. |
| Emails Collected |
The number of times participants provided a valid email address. |
| Days in Field |
The number of days that have elapsed since the first activity view. |
| Device Breakdown |
The percentage of participants who viewed
the activity on different device types. Options include:
|

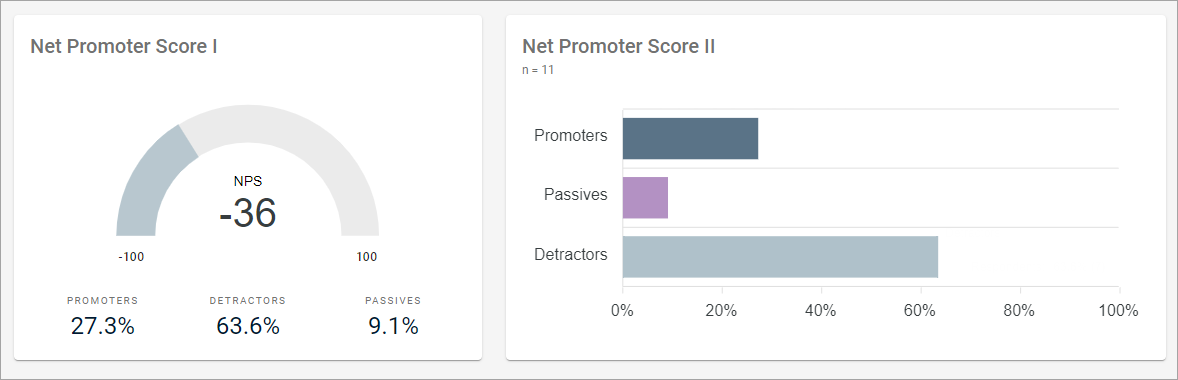
For Net Promoter Score (NPS)℠1 activities, visuals that show the breakdown of Promoters, Detractors, and Passives are displayed.
| NPS® metric | Description |
|---|---|
| NPS |
The Net Promoter Score℠ (NPS®) is calculated by subtracting the percentage of Detractors from the percentage of Promoters. The NPS® can range from -100 (everyone is a Detractor) to 100 (everyone is a Promoter). An NPS® close to 0 means the number of Detractors and Promoters is roughly equal. |
| Detractors | Participants who rated something from 0 to 6, indicating they would not recommend it. |
| Passives | Participants who rated something from 7 to 8, indicating neutral feelings. |
| Promoters | Participants who rated something from 9 to 10, indicating they would recommend it. |
To return to the Activity Insights list, click Activity Insights.