Response Breakdown (activities)
View a detailed summary of participants' answers to Touchpoint activity questions.
To view the Response Breakdown:
- In Touchpoint, go to the Activities page.
- Click the activity name.
The activity opens on the Report page.
- Click Response Breakdown.
- Optionally, you can also filter the Response Breakdown. For more information, see Filter report data (activities).
The Response Breakdown tab displays answer data for question screen types:
- Text Question (Single Choice and Multiple Choice)
- Image Question (Single Choice and Multiple Choice)
- Numeric Scale
- Text Entry
How data is displayed depends on the question type.
Text Question
For Text Question screens, the answer data is displayed as a horizontal bar chart.
- Hover over the answer text labels on the left to view the full answer text.
- Hover over the bars to view answer text, as well as the percentages and counts of participants who selected the answer.
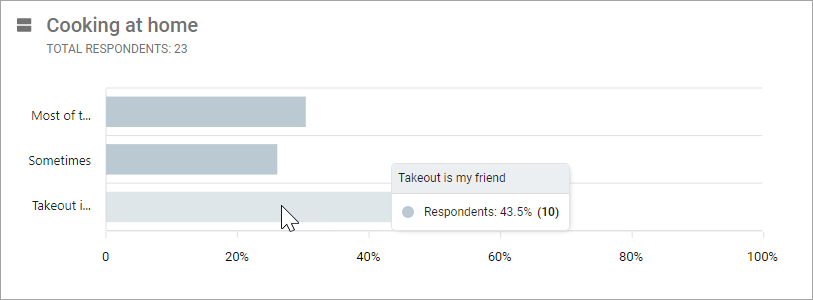
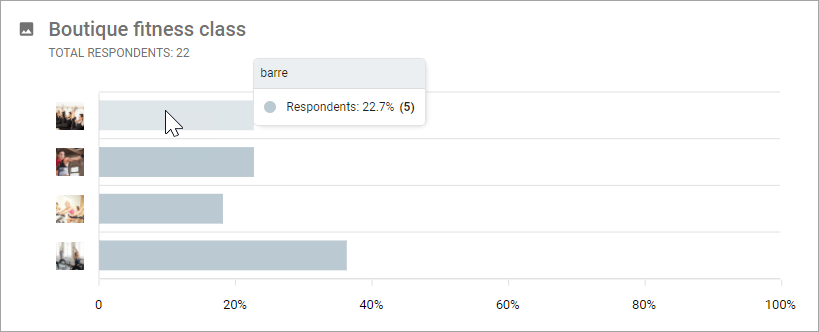
Image Question
For Image Question screens, the answer data is displayed as a horizontal bar chart.
- Hover over the images on the left to view larger thumbnails and alt text.
- Hover over the bars to view alt text, as well as the percentages and counts of participants who selected the answer.
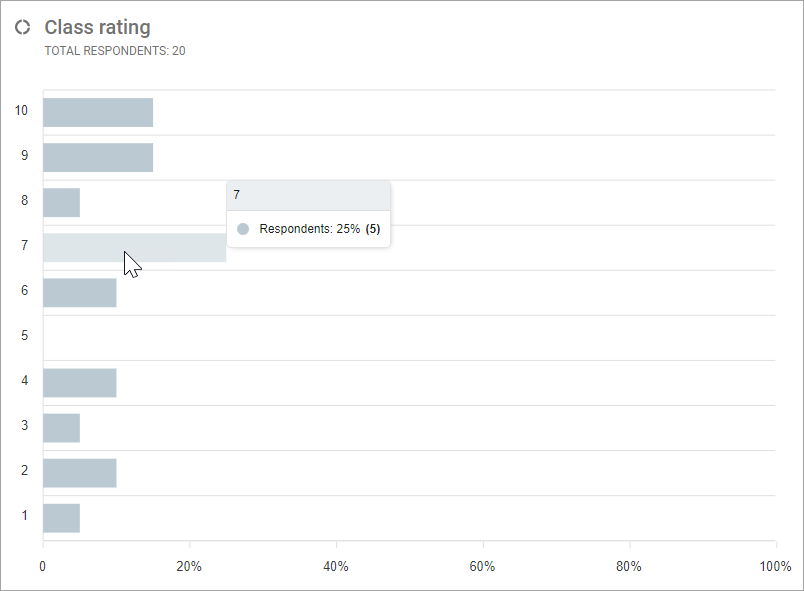
Numeric Scale
For Numeric Scale screens, the data is displayed as a horizontal bar chart. Each numeric rating has its own row. Hover over the bars to view the percentages and counts of participants who selected the answer.
Text Entry
For Text Entry screens, the data is displayed as a sentiment analysis. The summary percentages indicate the number of responses that are positive, neutral, negative, and mixed. The quadrant graph gives you an alternate visualization of the same data.
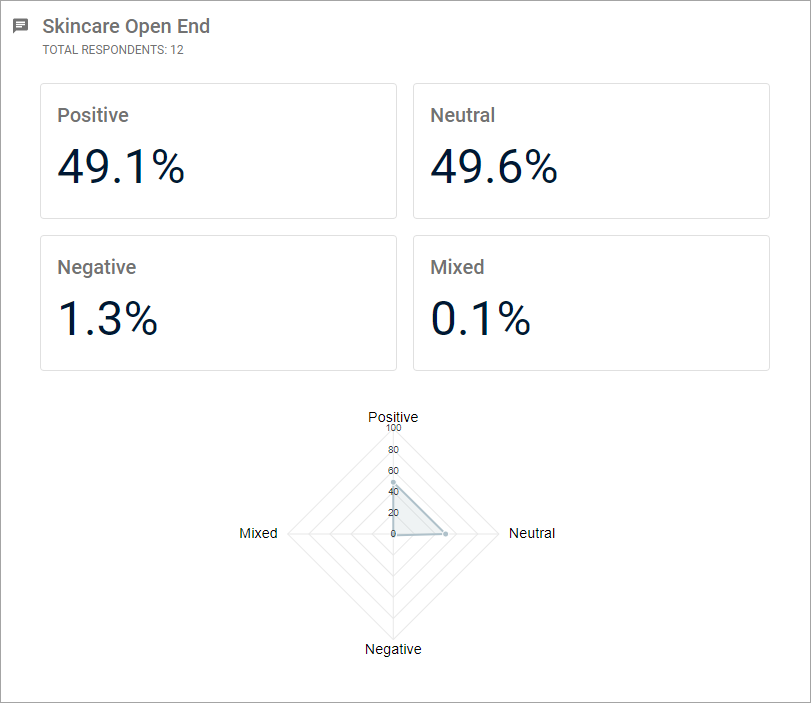
- To view the full response text, you must export the results.
- Sentiment analysis is
available for responses in the following languages:
- Arabic
- Chinese (simplified)
- Chinese (traditional)
- English
- French
- German
- Hindi
- Italian
- Japanese
- Korean
- Portuguese
- Spanish
Date Entry
To view Date Entry data, you must export the report data. For more information, see Export results (activities).